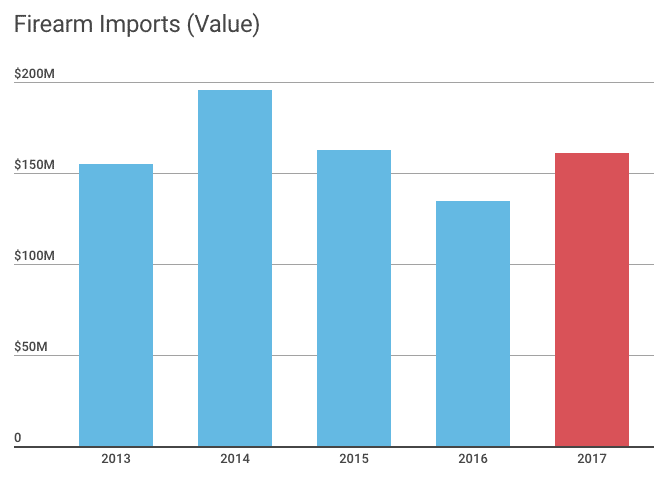
TheGunBlog.ca — Canada imports almost all the guns and ammunition sold in the country, making import data a key indicator of the industry. Companies keep their accounts private, so the figures published by Statistics Canada are one of the only windows into the market.
Following are more than a dozen charts and factoids (below the charts) based on StatsCan data. See also Notes & Assumptions at the bottom.
!function(e,t,n,s){var i=”InfogramEmbeds”,o=e.getElementsByTagName(t)[0],d=/^http:/.test(e.location)?”http:”:”https:”;if(/^/{2}/.test(s)&&(s=d+s),window[i]&&window[i].initialized)window[i].process&&window[i].process();else if(!e.getElementById(n)){var a=e.createElement(t);a.async=1,a.id=n,a.src=s,o.parentNode.insertBefore(a,o)}}(document,”script”,”infogram-async”,”https://e.infogram.com/js/dist/embed-loader-min.js”);
!function(e,t,n,s){var i=”InfogramEmbeds”,o=e.getElementsByTagName(t)[0],d=/^http:/.test(e.location)?”http:”:”https:”;if(/^/{2}/.test(s)&&(s=d+s),window[i]&&window[i].initialized)window[i].process&&window[i].process();else if(!e.getElementById(n)){var a=e.createElement(t);a.async=1,a.id=n,a.src=s,o.parentNode.insertBefore(a,o)}}(document,”script”,”infogram-async”,”https://e.infogram.com/js/dist/embed-loader-min.js”);
!function(e,t,n,s){var i=”InfogramEmbeds”,o=e.getElementsByTagName(t)[0],d=/^http:/.test(e.location)?”http:”:”https:”;if(/^/{2}/.test(s)&&(s=d+s),window[i]&&window[i].initialized)window[i].process&&window[i].process();else if(!e.getElementById(n)){var a=e.createElement(t);a.async=1,a.id=n,a.src=s,o.parentNode.insertBefore(a,o)}}(document,”script”,”infogram-async”,”https://e.infogram.com/js/dist/embed-loader-min.js”);
!function(e,t,n,s){var i=”InfogramEmbeds”,o=e.getElementsByTagName(t)[0],d=/^http:/.test(e.location)?”http:”:”https:”;if(/^/{2}/.test(s)&&(s=d+s),window[i]&&window[i].initialized)window[i].process&&window[i].process();else if(!e.getElementById(n)){var a=e.createElement(t);a.async=1,a.id=n,a.src=s,o.parentNode.insertBefore(a,o)}}(document,”script”,”infogram-async”,”https://e.infogram.com/js/dist/embed-loader-min.js”);
!function(e,t,n,s){var i=”InfogramEmbeds”,o=e.getElementsByTagName(t)[0],d=/^http:/.test(e.location)?”http:”:”https:”;if(/^/{2}/.test(s)&&(s=d+s),window[i]&&window[i].initialized)window[i].process&&window[i].process();else if(!e.getElementById(n)){var a=e.createElement(t);a.async=1,a.id=n,a.src=s,o.parentNode.insertBefore(a,o)}}(document,”script”,”infogram-async”,”https://e.infogram.com/js/dist/embed-loader-min.js”);
Highlights & Factoids
Firearms
- Total: +19% from 2016 to $161.5 million, first annual increase in three years.
- Value of imported handguns exceeds shotguns for first year on record.
- Country: Italy overtakes Turkey as the No. 2 country of origin by import value. U.S. continues to dominate as No. 1.
- Rifles: Tennessee leapfrogs Connecticut as No. 1 place of origin by quantity.
- Shotguns: Turkey holds the No. 1 spot by number, and Italy advances to No. 2 from No. 4.
- Handguns: Arizona jumps to No. 1 place of origin by quantity from No. 6 in 2016.
- May: highest value of guns ever imported in a single month, as companies brought in new models and stocked up before the expected June 1 start date of import restrictions known as the Firearms Marking Regulations. The rules were delayed.
- May: spike was led by shotguns from Italy and rifles from Finland and Czech Republic. Didn’t affect handguns or ammo.
- June-November: Six straight months of decline.
- December: first monthly increase in seven months.
- Then: January 2018 imports plunged to a five-year low.
Ammunition
- Total: +0.004% to $149.649 million.
- Rifle and handgun: +1.2% to $128 million.
- Shotgun: -8.6% to $16.7 million.
Parts & Accessories
- Total: +6.1% to $42.5 million
Notes & Assumptions
- Source: Statistics Canada. Innovation, Science and Economic Development Canada. (Statistics Canada doesn’t identify companies or brands.)
- Economic Value: The economic value of hunters and sport shooters goes far beyond the guns, ammo and parts that we buy. A trip to the range could include range fees, match fees, gas, food, ear protection, eye protection, gloves, optics, belts, holsters, magazine carriers, hats, locks, cases and clothes. A hunting trip could include many of those, plus travel, lodging, hunting permits, guides, vehicle rental (ATV, canoe, sled, …), game calls, trail cams, knives, tents, sleeping gear, insurance …
- Retail value of firearms is roughly 25% more than the import value.
- Listed place of origin isn’t necessarily the same as place of manufacture.
- StatsCan’s classification for “parts and accessories” doesn’t include everything. Some items have their own category.
- Imports don’t cover the entire industry. Some Canadian companies make firearms, ammunition and parts domesitcally.
- Assumptions: Companies order the guns that they expect clients will buy or ones that have already been contracted, such as for police. They buy less when they expect demand to slow. It typically takes three to six months from when companies place a purchase until shipments arrive. It takes at least another month until the statistics are published.
- Canada Border Services Agency collects import information and shares the data with StatsCan.
- Trends in gun licences for individuals and firearm registrations provide insight into the firearm market, in addition to imports.
The most important part of gun rights isn’t “gun,” it’s “rights.”
